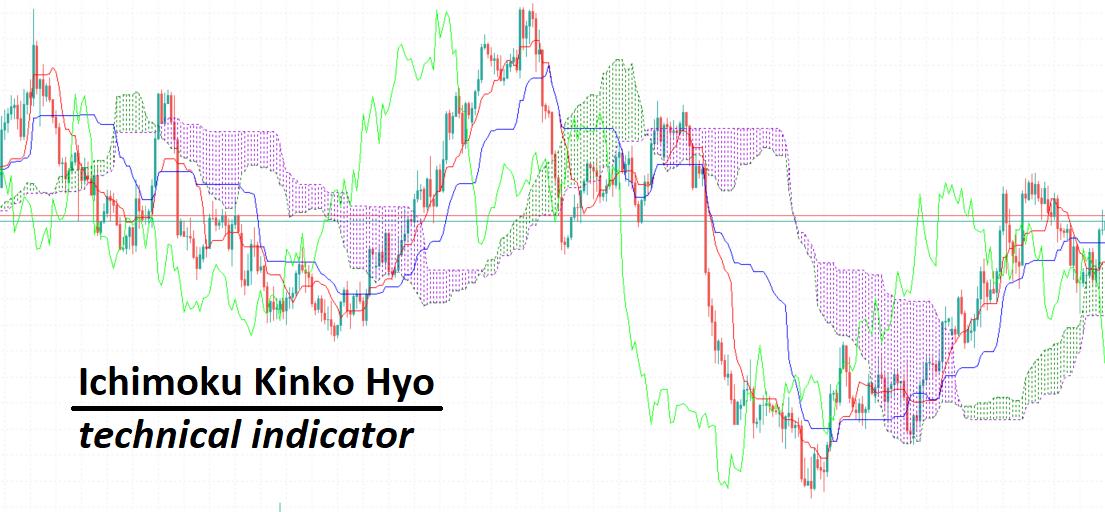
Ichimoku Kinko Hyo (IKH) was developed in the late 1960s by the Japanese journalist Goichi Hosoda and it’s a technical analysis indicator which provides a comprehensive view in several aspects like price movement, support and resistance levels and trend strength, all in a single chart. It can be translated as ‘one glance equilibrium chart’ which reflects its purpose, that is for traders to be able with ’one look’ a trading chart pair to determine momentum, support and resistance levels.
How Ichimoku Kinko Hyo can be used?
At first, Ichimoku Kinko Hyo may seem very complicated.
However, once we analyze what the various lines and color areas mean, its complexity will soon disappear. It is important to state that as other technical indicators, Ichimoku is best to be used in conjunction with other indicators and technical analysis forms.
We will check Ichimoku Kinko Hyo and its settings using the MetaTrader 5 trading platform.
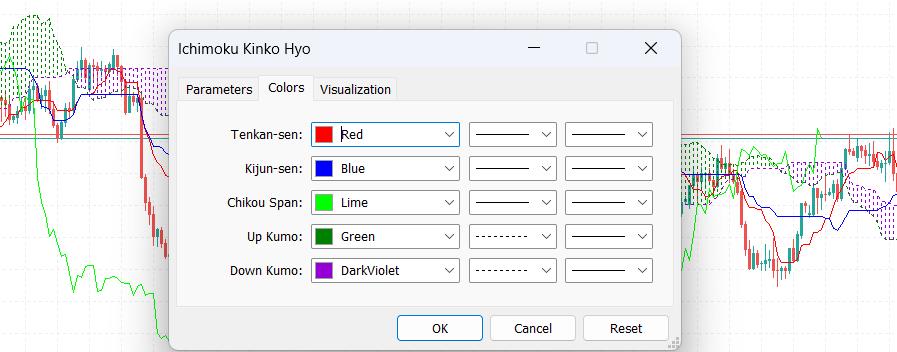
The indicator consists of five (5) components:
Tenkan-sen (Conversion Line): It is calculated by averaging the highest high and the lowest low over a specific period, while the default value is nine (9 periods). It represents the short-term trend and is often used as a support/resistance level as well as signal line for reversals.
Kijun-sen (Base Line): It is calculated in a similar way as the Tenkan-sen, but over a longer period. The default setting is twenty-six (26) periods, averaging the highest high and the lowest low. It represents the medium-term trend and is considered a stronger support/resistance level.
Chikou Span (Lagging Span): It is created by plotting closing prices over a specific period. By default, its setting value is twenty-six (26) periods, behind the latest closing price of an asset. The Chikou Span can be used by traders to confirm the strength of the current trend. If the Chikou Span is above the price and has a clear separation, the signal is bullish. In case it is below the price and shows clear separation, it supports a bearish signal.
Senkou Span A and Senkou Span B (colored area – Kumo cloud): Senkou Span A and Senkou Span B lines are used to form the cloud formation in an Ichimoku Kinko Hyo diagram. The Senkou Span A is calculated by adding the Tenkan-sen and the Kijun-sen, dividing the result by two, and then plotting the result twenty-six (26) periods ahead. The Senkou Plan B is calculated by adding the highest high and the lowest low over the past fifty-two (52) periods, dividing it by two, and plotting the result twenty-six (26) periods ahead. Both Span A and Span B form support and resistance levels.
The Kumo cloud changes colors based on the trend direction. When the Kumo Up prevails, we notice an uptrend which is caused due to the Senkou Span A rises above the Senkou Span B. Alternatively, when the Span A falls below Span B, a downtrend starts to be formatted.
Let’s analyze an example, checking certain parts of the Ichimoku Kinko Hyo technical indicator.
The first thing to determine is the overall direction of the price trend. This can easily be found with Tenkan-sen and Kijun-sen lines. Crossovers may mean that a new trend is forming. Support and resistance levels can be assessed by Senkou Span A and Senkou Span B, which will form the Kumo cloud. In addition, when Senkou Span A crosses above Senkou Span B, it indicates a bullish shift. In case Senkou Span A crosses below Senkou Span B, it indicates a bearish shift.
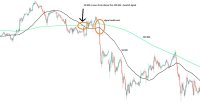
At the below image, we can notice the trend change by checking Tenkan-sen and Kijun-sen lines.
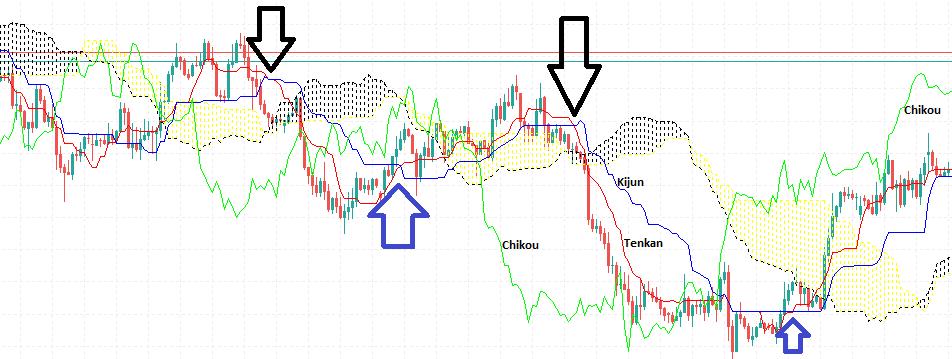
At the black arrows, we notice that Tenkan drops below Kijun. That’s a signal for a possible course change at the current price from uptrend to downtrend. The short-term trend indicator falls below the medium-term with a downtrend direction.
On the other hand, the blue arrows indicate the exact opposite. The short term Tenkan-sen surpasses Kijun-sen with a signal for an upward price movement.
At the second black arrow, we have another confirmation by checking the Chikou Span. The Chikou is trading below the market’s price, which means that we have another signal indication of a downtrend. The price soon falls below the Kumo cloud and we have a solid indication of a downtrend movement in prices.
It is important to notice that Ichimoku Kinko Hyo is not a standalone indicator and is typically used together with other technical analysis tools, like Moving Averages. Risk Management techniques are also useful to be followed when we are constructing a trading plan. Practice, experience and back-testing are crucial for understanding fake signals and adapting a trading strategy accordingly as Market conditions are changing in unpredictable rhythm.