In order to construct such a trading strategy, there are two (2) basic analyses that are being followed: The Fundamental Analysis and the Technical Analysis.
The Fundamental Analysis examines qualitative and quantitative factors which may affect the performance or price action of an asset. It mostly evaluates in a theoretical level many factors which can affect the general Market sentiment and impact prices taking into consideration all relevant information available. More specifically, it focuses on regulatory environments and restrictions, general economic indicators and financial data and statements.
On the other hand, Technical Analysis focuses more on quantitative and measurable data and information to analyze the Markets. The study of historical data, mainly price levels and trading volumes, is the most useful tool to reach to a solid trading plan or a simple trading decision. The use of this data focuses on finding trends and patterns of the Market. Once a trend or a pattern is found, then the price movement can be predicted, although not 100% guaranteed.
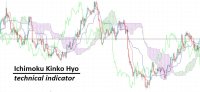
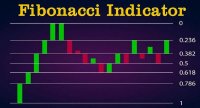
The main tools for a Technical Analysis are the use of: Technical Indicators, chart patterns, Support and Resistance Levels and Fibonacci retracement levels.
We will briefly analyze one of the most commonly used Technical Indicator, the Moving Average (MA) technical indicator, which mainly assists smoothing price fluctuations and spotting price trend directions. The Moving Average (MA) is a lagging indicator. Based on historical data and information, it can identify market trends but only after these have already begun.
Its calculation is quite simple, by averaging the prices of an asset over a specified time period and connecting the results in a continuous line. Common Moving Averages (MA) which are being used to identify trends are the 50-day MA, the 100-day MA and the 200-day MA.
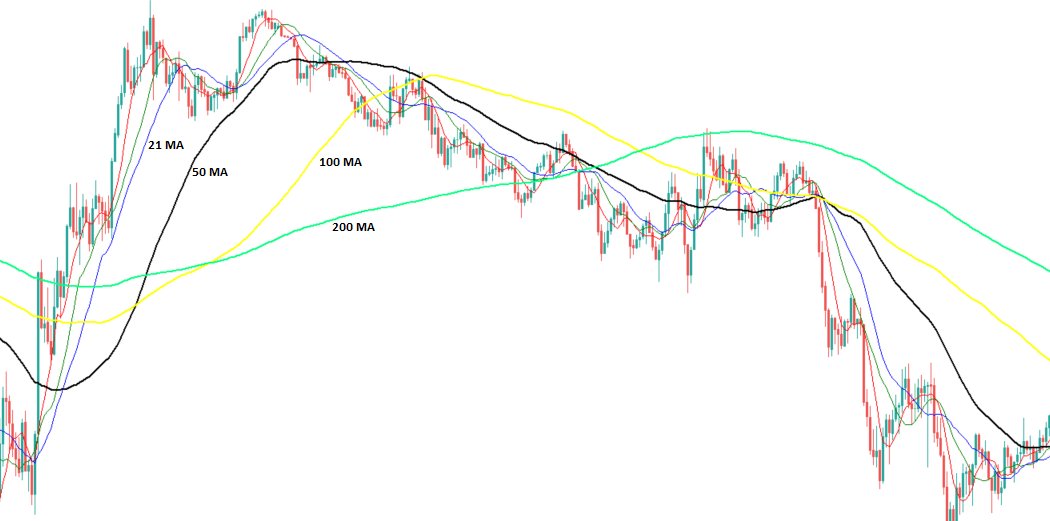
In turns, Moving Averages have many types which can be used by traders. Most common ones are the Simple Moving Average (SMA) and the Exponential Moving Average (EMA). SMA calculates the sum of the closing prices of an asset during a specified time period dividing by the number of these periods. EMA does the same thing, but giving more weight to the most recent price data. Hence, it provides results with more weight to the most recent prices.
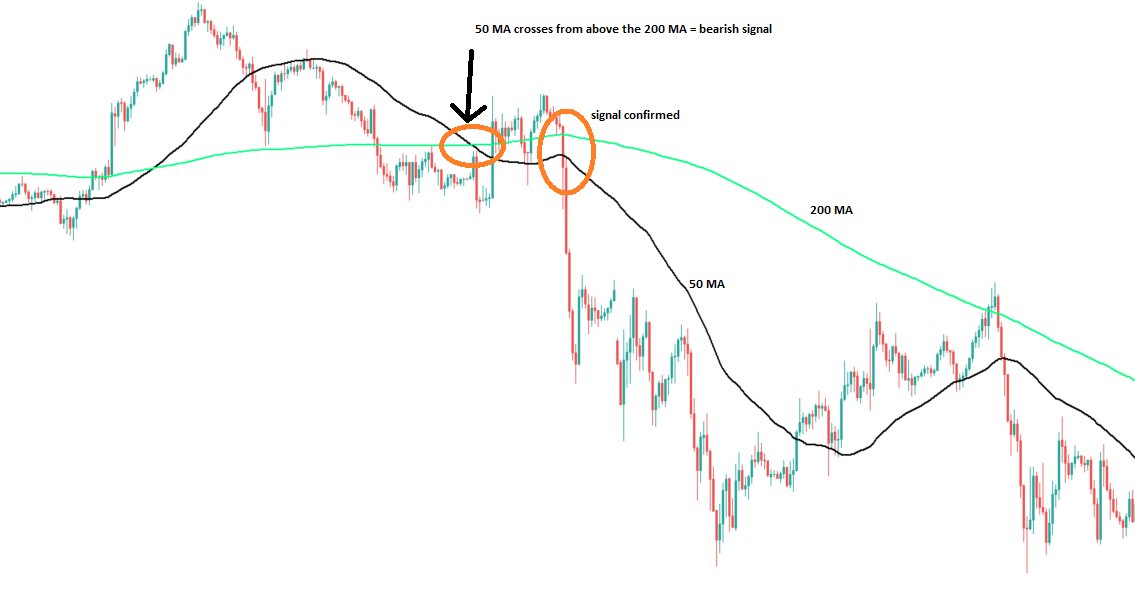
When an asset’s price is above a Moving Average is an uptrend, while if the price is moving below a Moving Average is considered to be a downtrend.
The most common trading strategy for Moving Averages is the ‘’crossover’’ strategy, where traders trying to spot bisections of different Moving Averages. An example can be an intersection of the 50-day and the 200-day Moving Averages. When the 50-day MA crosses from below the 200-day MA, it’s considered a bullish signal, while when the 50-day MA crosses from above the 200-day MA, it’s considered a bearish signal.

In conclusion, Moving Averages technical indicators may be useful in identifying trends at the Markets. It is imperative though, to be used together with other technical tools and fundamental information before making a trading decision. Traders should be aware that ‘’one tool guaranteed winning trades’’ does not exist.